
Courtesy of PLOS One
·
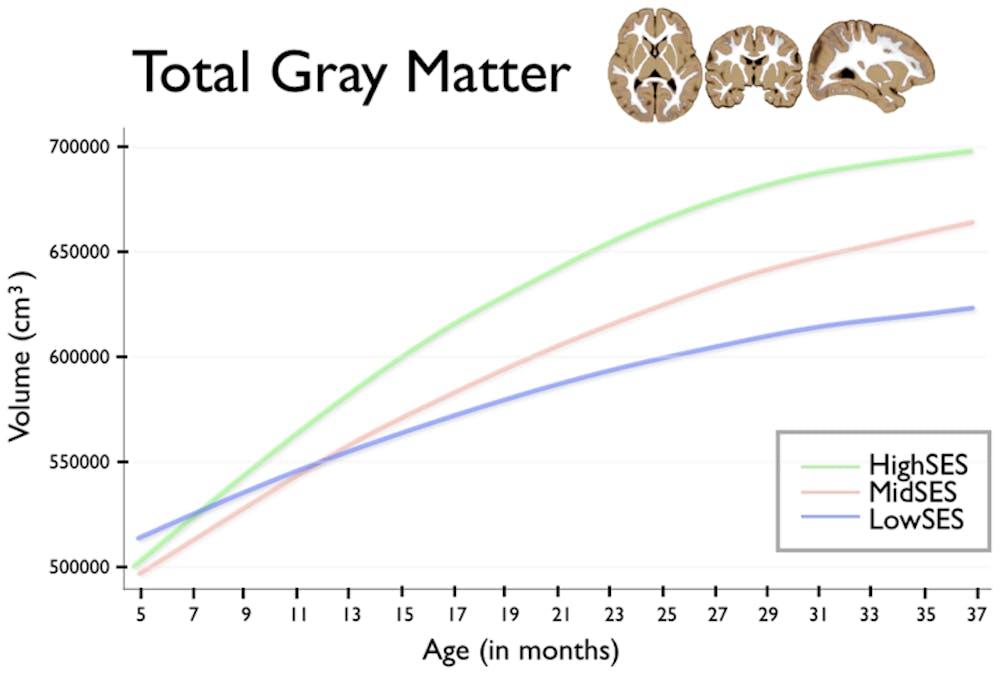
This figure displays the total gray matter for each income group by age. Low income households are represented by the blue line, middle income households by the red line and high income households by the green line.
More


26_6_9-Mintz-Steenbock-3.jpg
By Jonathan Mintz | Jun. 10The first floor of Steenbock Memorial Library photographed on Tuesday, June 9, 2026.

26_6_9-Mintz-OneAlumniPlace-1.jpg
By Jonathan Mintz | Jun. 10The exterior of One Alumni Place photographed on Tuesday, June 9, 2026.